Cal Poly Ventures is an early-stage investment fund that supports high-growth Cal Poly-affiliated startups. I was selected as CPV’s sole student employee to source and present deals directly to venture capital partners. I designed a deal-flow database from scratch to meet the firm's needs. I continue to manage and query the database, outreach to prospects, and assess investment opportunities. The database contains 650+ companies and 1000+ records in total. The database helped drive over 50% of deals presented to the investor team in 2022.
Tech Stack: Airtable, Crunchbase, Tableau
Note: Actual data has been removed for privacy purposes.
Note: Actual data has been removed for privacy purposes.
Company Dealflow Table
The "Company Dealflow" table is the central repository for tracking potential investment opportunities within the venture fund's pipeline. Each entry represents a startup or company, offering detailed insights about its status, industry, founders, funding history, and other pertinent data. By incorporating fields such as "Point of Contact," "Date of Last Contact," and "Fundraising Status," the table ensures that stakeholders can efficiently manage communications and monitor deal progression. This database, built on Airtable, is primarily populated through a Crunchbase CSV upload tool, providing up-to-date and accurate information. The table's several views including a timeline, kanban board, and segmented list make it easy for venture fund members to organize batches of companies for outreach and track deal flow.
Founder Contacts Table
The "Founder Contacts" table acts as a relational database, focusing on the founders and key personnel associated with the companies in the "Company Dealflow" table. This table provides a granular view of each founder, encapsulating their professional title, contact details, affiliations, and a direct link to their respective companies. Such a setup is crucial for establishing and nurturing relationships with these industry leaders. The Airtable foundation, combined with the Crunchbase CSV connection, ensures that the contact information remains current and relevant. I've built an outreach tool that connects to this table and helps to automate personalized and targeted communication based on the most recent funding data. This helps our team foster stronger relationships with the entrepreneurs driving the startups in our pipeline.
Tableau Dashboard
For my senior project I worked with the CIE’s Cal Poly Venture Fund, and had the opportunity to work with real-world prospect data for a venture capital firm. I took an online course to learn Tableau Desktop fundamentals and turned the fund’s prospect database into an interactive Tableau dashboard with dynamic visualizations. Throughout the project I built live data connections, cleaned and structured raw data, and designed an easily navigable solution that addressed the fund’s unique needs. I was able to develop a valuable tool for the CPV Fund that helps them identify untapped market segments and new investment opportunities. I presented my final project at an Investor Board meeting and received positive feedback from our board members and my project advisor.
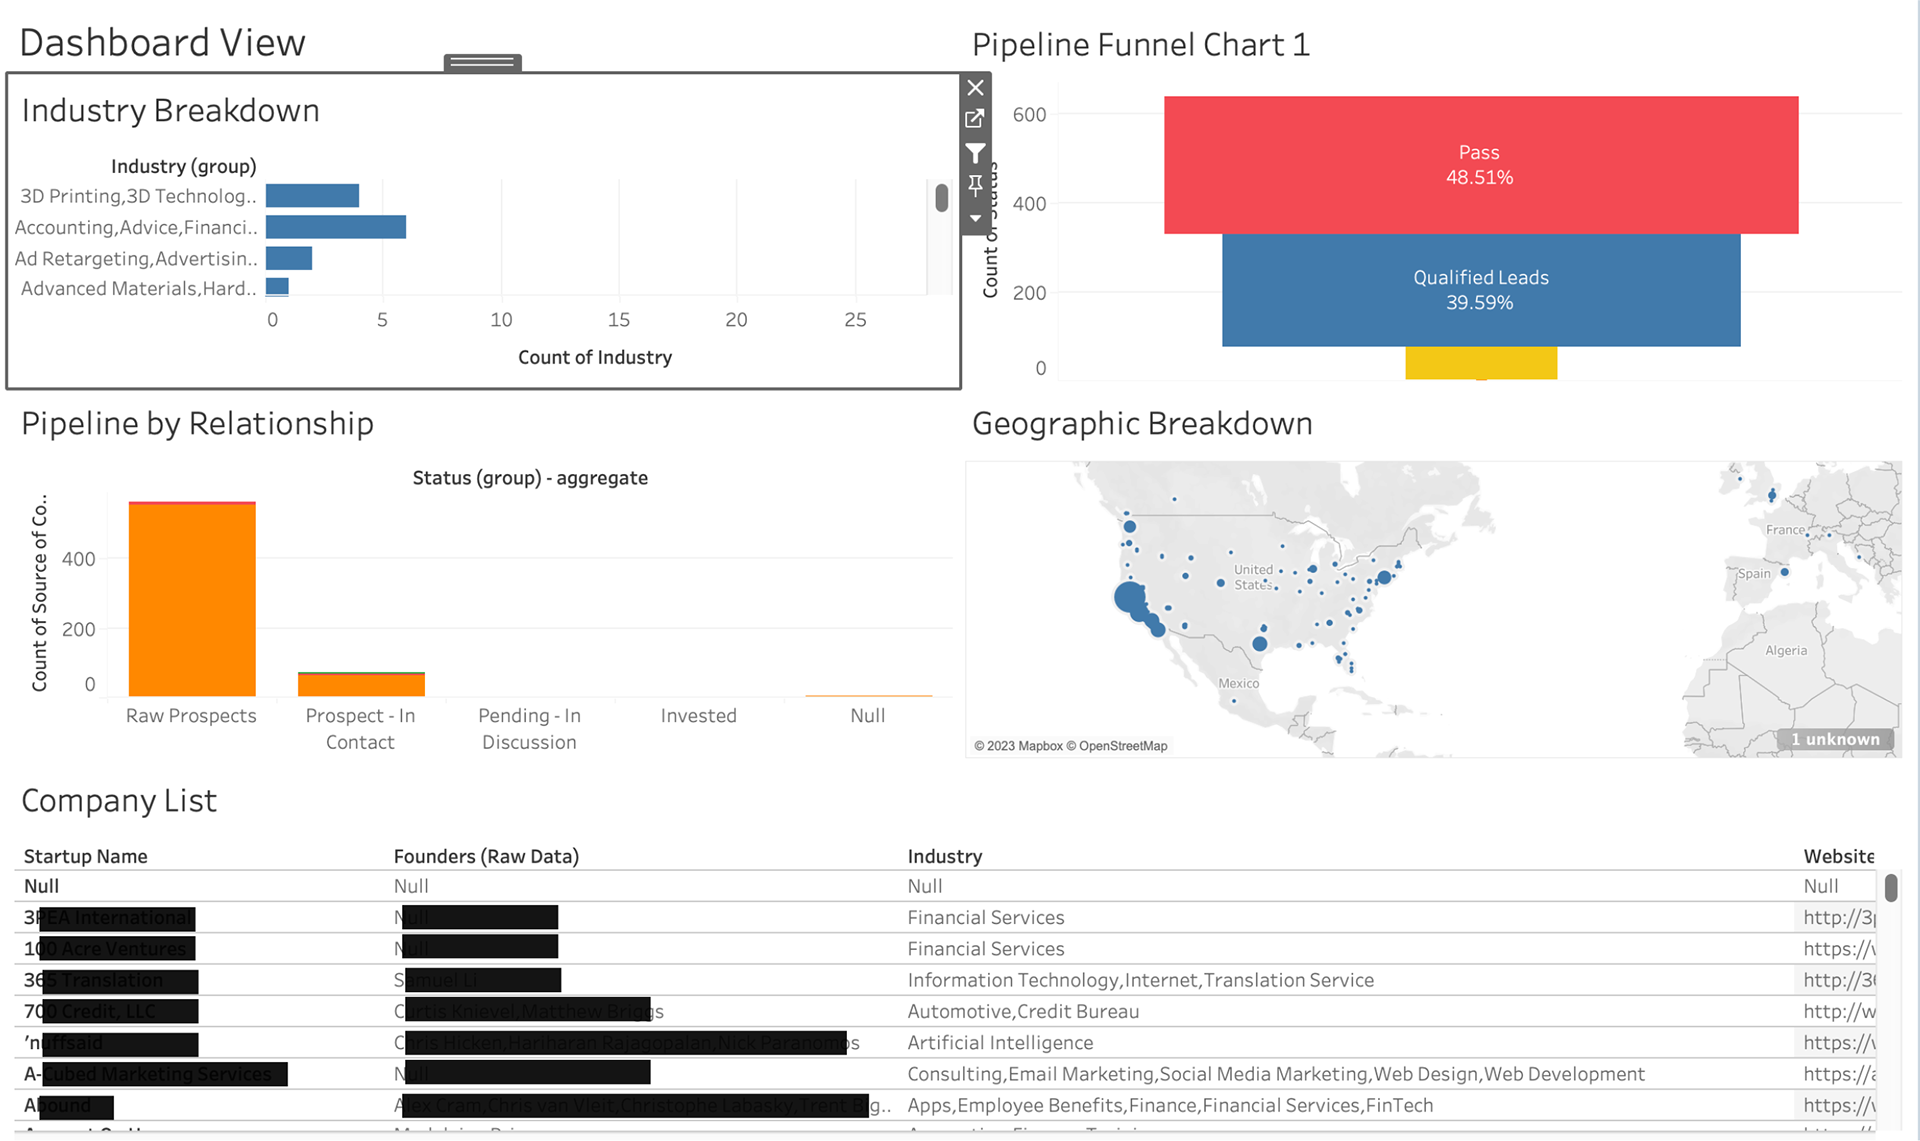
Tableau Dashboard Charts
Industry Breakdown: This chart would show the breakdown of CPV's investments by industry to identify which industries CPV invests in the most.
Geographic Breakdown: This chart would show the breakdown of CPV's investments by location to identify which regions CPV invests in the most.
Fundraising Status: This chart would show the fundraising status of each company to identify which companies are currently fundraising and which have closed fundraising.
Pipeline Funnel Chart: A funnel chart can be used to show the flow of companies through the different stages of the pipeline, from initial screening to final investment decision. This can help investors identify bottlenecks in the process and optimize their sourcing efforts.
Pipeline by Affiliation: A stacked bar chart that shows the number of companies in each affiliation category, such as "alumni", "current student", "faculty", "staff", etc.
Pipeline by Relationship: A network graph that shows the relationships between companies and dealflow sources (CIE, Crunchbase, Y comb, etc.). This could help investors visualize the network of connections between different companies and identify potential investments.
Founder Diversity Heatmap: A heatmap can be used to visualize the diversity of the founders in the pipeline, based on gender, race, ethnicity, or other relevant factors. This can help investors improve DEI outcomes.